

Following up on our last post on the benefits of starting small with any maintenance project, we’ll now walk you through our step-by-step guide for creating a maintenance analytics program by starting small and growing it piece-by-piece 🧱.
Step #1: Ask the right questions
You need to be clear on the reason/purpose of why you’re collecting data in the first place, so consider questions like:
- What are your business’s biggest goals and how can maintenance impact them?
- What challenges is your company facing and how can maintenance solve them?
- What opportunities can your organization pursue and how can maintenance help?
Answering these questions will give you a clear view of where your team can make the biggest impact with the fewest obstacles.
To help you get started, here are a few examples of how you may answer these questions:
| What are your business’s biggest goals? Ex. Reduce waste across all business units | How can maintenance impact those goals? Ex. Increase preventive maintenance to reduce downtime and maintenance costs |
| What challenges is your company facing? Ex. Inflation is driving up the price of materials, which is shrinking profit margins | How can maintenance solve those challenges? Ex. Improve asset performance to increase production capacity and quality |
| What opportunities can your organization pursue? Ex. Demand is exceeding capacity, so the company is looking to expand | How can maintenance help? Ex. Create, optimize, and standardize processes that can accelerate expansion |
Step #2: Connect data to your goals, challenges, and opportunities
Take your answers from Step 1 and list the different ways you can measure maintenance for each of them. Don’t hesitate to include maintenance metrics you currently aren’t tracking, and if you feel overwhelmed by your list, focus on 2-3 that have the strongest connection to maintenance.
You’ll end up with something like this:
| What are your business’s biggest goals? Ex. Reduce waste across all its operations | How can maintenance impact those goals? Ex. Increase preventive maintenance to reduce downtime and maintenance costs | What data can help you track progress?
|
| What challenges is your company facing? Ex. Inflation is driving up the price of materials, which is shrinking profit margins | How can maintenance solve those challenges? Ex. Improve asset performance to increase production capacity and quality | What data can help you track progress?
|
| What opportunities can your organization pursue? Ex. Demand is exceeding capacity, so the company is looking to expand | How can maintenance help pursue those opportunities? Ex. Create, optimize, and standardize processes that can accelerate expansion | What data can help you track progress?
|
Step #3: Choose your north star
This is the one activity or metric you’ll anchor all your efforts to. If your project is growing too large and feels unmanageable, your north star will bring focus and clarity back to your efforts.
The first north star to pick is a goal, challenge, or opportunity that you’ll build your maintenance analytics program around. For example, it might be improving asset performance to increase production capacity and quality.
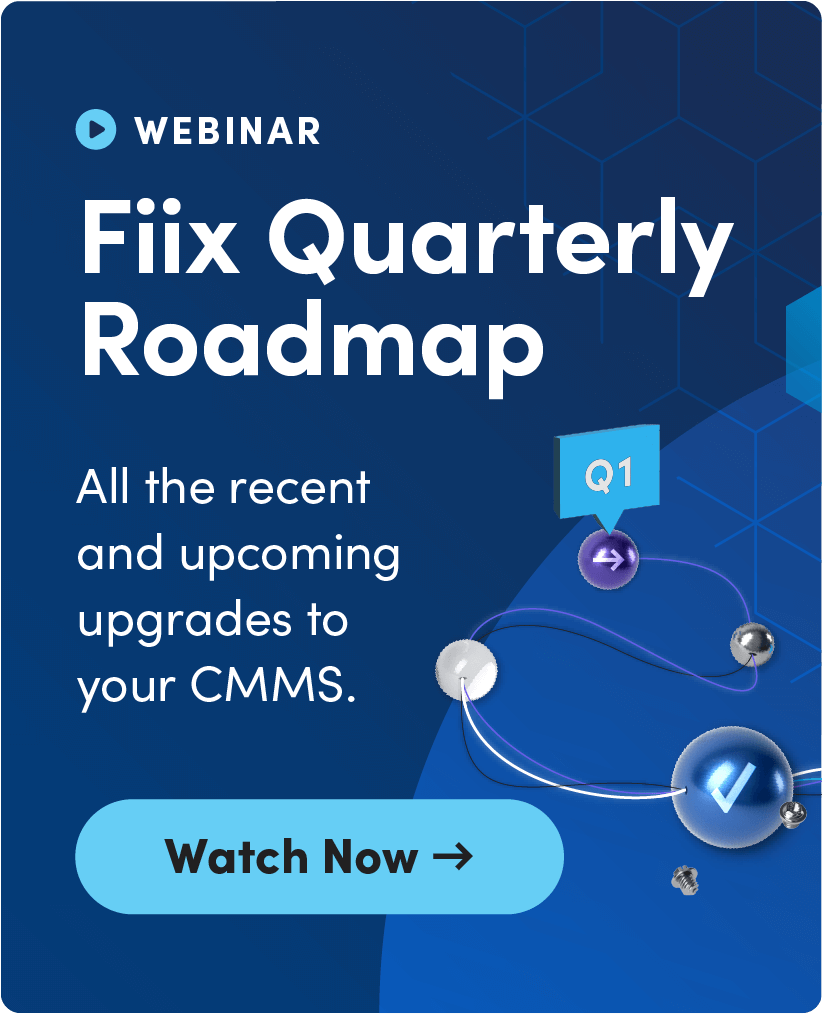
Once you’ve done that, you’ll then need to narrow your list of data points. To decide which metrics to start with, use the matrix below. It will help grade data on usage (how much it can guide your decision-making) and accessibility (how easy it is to collect and analyze):
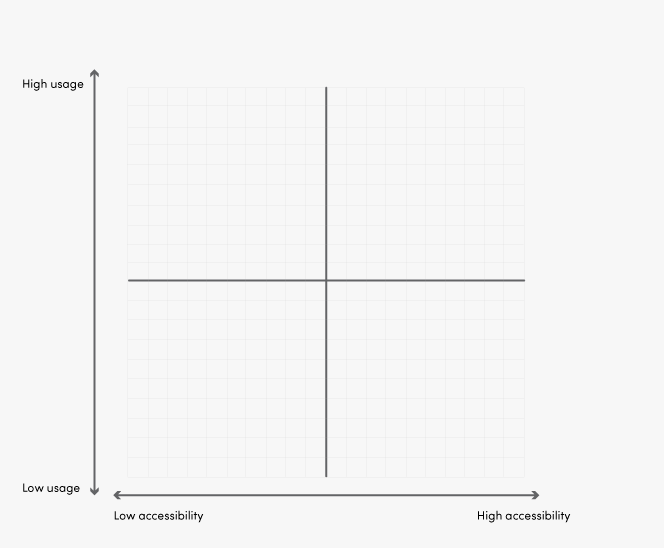
Here’s what the matrix looks like using the challenge and corresponding metrics from step #2:
Following this example, you’d want to build your maintenance analytics program using two metrics: recurring incidents and clean startups after maintenance.
Step #4: Find your starting point
Starting small means choosing one line, shift, site, or task for tracking data. Here’s a template for picking a starting point, using clean startups after maintenance as the metric:
| Questions to ask | Outcome | Starting point |
|---|---|---|
| Where’s the greatest opportunity? | Assets with the highest rates of post-maintenance failure | Site #1 Shift #1 Assets A, B, and C |
| Where can I get the most data? | Assets with the most maintenance | Site #2 Shift #1 Assets A, C, and E |
| What will make the biggest impact? | Assets with the highest target throughput | Site #1 Shift #2 Assets A, B, E |
| Where is this strategy the easiest to implement? | Sites and shifts where this data is already being collected | Site #1 All shifts Assets A, C, E |
Using this chart, we can see the most opportunity and impact (with the least effort) can be had on site #1 and assets A and E.
Step #5: Assemble your people, processes, and systems
Now let’s answer the following questions about your people, processes, and systems so you can ensure that you have a strong foundation for your maintenance analytics program:
| People
|
| Processes
|
| Systems
|
Step #6: Plan, do, check, act (PDCA)
The PDCA model helps you make use of your data and fill the gaps in your maintenance analytics program. Here’s how it works:
| Plan | Put all the details about what data you’re collecting, how you’re collecting it, and what you’re doing with it into a standard operating procedure. Everyone can refer to this document when learning the new process. |
| Do | Follow through with the plan. Consistency is key. Collect data at the same frequency, in the same way, for as long as it takes to get reliable results. |
| Check | Analyze the data and find out if your plan is working. On the data side, make observations and find insights. For example, the observation might be that clean startups increased 25% last month. The insights could be that the specs were recently updated on those machines so repairs were more in line with the operating contexts. On the planning side, audit your processes, people, and systems. If you see roadblocks, like missing or inaccurate data, find the root cause. |
| Act | Use the insights from the previous step to make decisions. If spec changes led to more clean startups, audit and update specs on all assets. The same goes for your processes, people, and systems. If a technician is lacking information, for example, consider giving them extra training. |
Step 7: Scale!
Expanding your maintenance analytics program can be straightforward from an operational perspective (take the formula that worked well and apply it to more shifts, sites, or assets). But a larger program requires more of everything, like:
- Training
- Standard operating procedures
- System functionality
- Buy-in
- Reporting
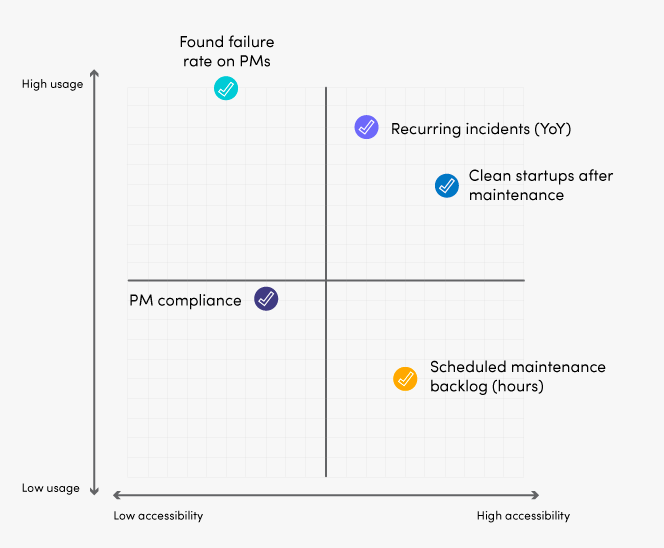
A key piece of scaling your analytics program is convincing people to give you more time and money for all these things. Check out this infographic below that will help you highlight the value of your program:
How is your maintenance analytics program set up? Which of these steps have been most impactful for you? Let us know in the thread below. 👇